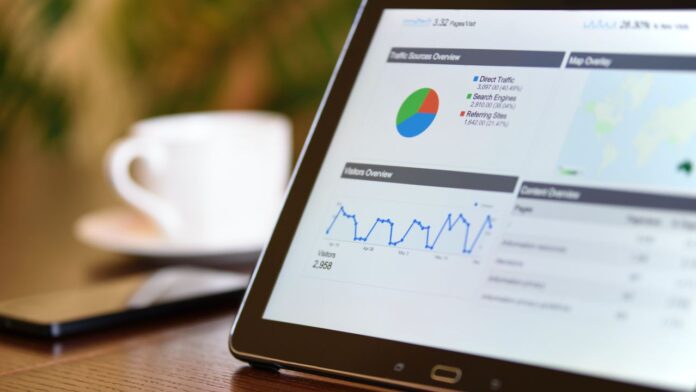
Whether tracking results for yourself or reporting to a client, website analytics is essential. This beginner’s guide demystifies the world of analytics and gives you the knowledge to monitor your website like a pro.
Google Analytics is a free service that every online entrepreneur should install and understand. This article will provide an overview of the essential functions that every site should be tracking.
What is Google Analytics (GA)?
GA is a tool by Google for tracking websites. It’s a free platform collecting data regarding interactions of the users with your website. The collected data is sorted and presented in easy-to-read reports by Google Analytics.
It also provides tools that help you understand your audience, like identifying the ages and genders of visitors. You can also use GA to track goals and conversions. For example, you should increase your product sales or get more people to sign up for your email newsletter. GA can show you which pages and elements are working and which need improvement.
To begin using GA, you must install JavaScript code on your website. Once this is done, GA will start recording user data and generating real-time reports. It is important to note that GA does not collect personal information, such as names or addresses, without the user’s explicit consent. It also does not allow you to track visitors that have installed an anti-tracking software or browser extension. In 2019, Google introduced a new version of GA called Universal Analytics, which merges web and app properties into one data stream.
Why is Google Analytics needed?
Google Analytics is a free tool that helps businesses track their website’s performance. It also provides valuable insight into user behavior which can be used to optimize content and improve overall marketing ROI.
Metrics are quantitative analyses of a particular data type, including average session length, number of pages visited, and total time spent on the site. Google Analytics offers many metrics that can be sliced and diced differently to help marketers find valuable insights.
With a few clicks, web admins can install the GA tracking code to their websites and begin collecting user data in minutes. Once the tracking code is installed, the platform will automatically record and analyze your website’s traffic. In addition, Google Analytics can be integrated with other tools like Google AdWords and Search Console to provide a complete marketing platform. GA can also be filtered to avoid skewing data by filtering out office IP addresses, which is helpful when working with remote teams. Google Analytics can be as straightforward or complex as you want, making it an essential tool for any online business.
How do I install Google Analytics?
Google Analytics is a free tool that provides data you can use to grow your business. It works by placing a tracking code on every page of your website (before the /head> tag). You need to create a Google account to access the data, and you can grant access to other users using the admin panel.
Once you have a Google account, navigate to the Google Analytics website and click Get Started. You will be asked to choose your account name, industry category, and reporting time zone. Next, you will be prompted to create a property. This is where you will be given a unique tracking ID.
You will also be given instructions to install the tracking code on your website. This is usually done by using a plugin for WordPress. Once you have the tracking code, placing this on every site page is essential. The tracking code will return the information to your analytics account whenever someone visits your website.
[PS: You should also read our WordPress Guide For Beginners]
What are the advanced reports I should be looking at?
A quality analytics platform can help you collect insights with reports and real-time dashboards. It should also convert data relationships into visualizations that are easier to understand and analyze. This will make your life much easier as you can look closely at your company’s operations and strategies to identify the best possible outcomes for your business.
Plenty of options exist if you are looking for a more advanced tool. Some platforms are designed specifically for sophisticated data analysts and scientists, while others offer a more user-friendly experience for non-technical users. For example, Mode offers an interactive SQL editor and notebook environment. At the same time, a self-service business intelligence tool allows users to point and click on queries for construction.
You will also want to consider the security features of your selected analytics software. Make sure that the security is robust enough to protect your sensitive information. Evaluating the training available on the platform is also a good idea to ensure that your employees can use it properly.
What are the basic reports I should be looking at?
There are many different analytics tools available. When choosing one, consider how it will be used in your organization. Some are better for sophisticated data analysts and scientists, while others offer a more intuitive interface for less technical business users. It would help if you also thought about the tool’s data modeling capabilities. Some support a semantic layer, while others require users to use SQL or a separate modeling tool. Finally, consider price and licensing.
Most analytics tools work best with accessible, centralized data. If your data isn’t centralized, it cannot be easy to run analysis and create visualizations. It can help by streamlining your data pipeline, so you can quickly access and analyze your data sources.
Some popular analytics tools are free, open-source web applications allowing users to create interactive documents with live code, equations, and visualizations. Other options include the R programming language, a statistical computing environment offering graphical data visualization tools. Other tools offer a suite of business intelligence applications for self-service analytics and are more targeted at non-technical users.

